
TMUA 2017 Paper 2 Question 7
P2·Indices, Logarithms & Exponentials, Functions, Transformations & Graphs·6.0Official · 2017 · Q7
exponential-graphgrowth-ratemulti-statement
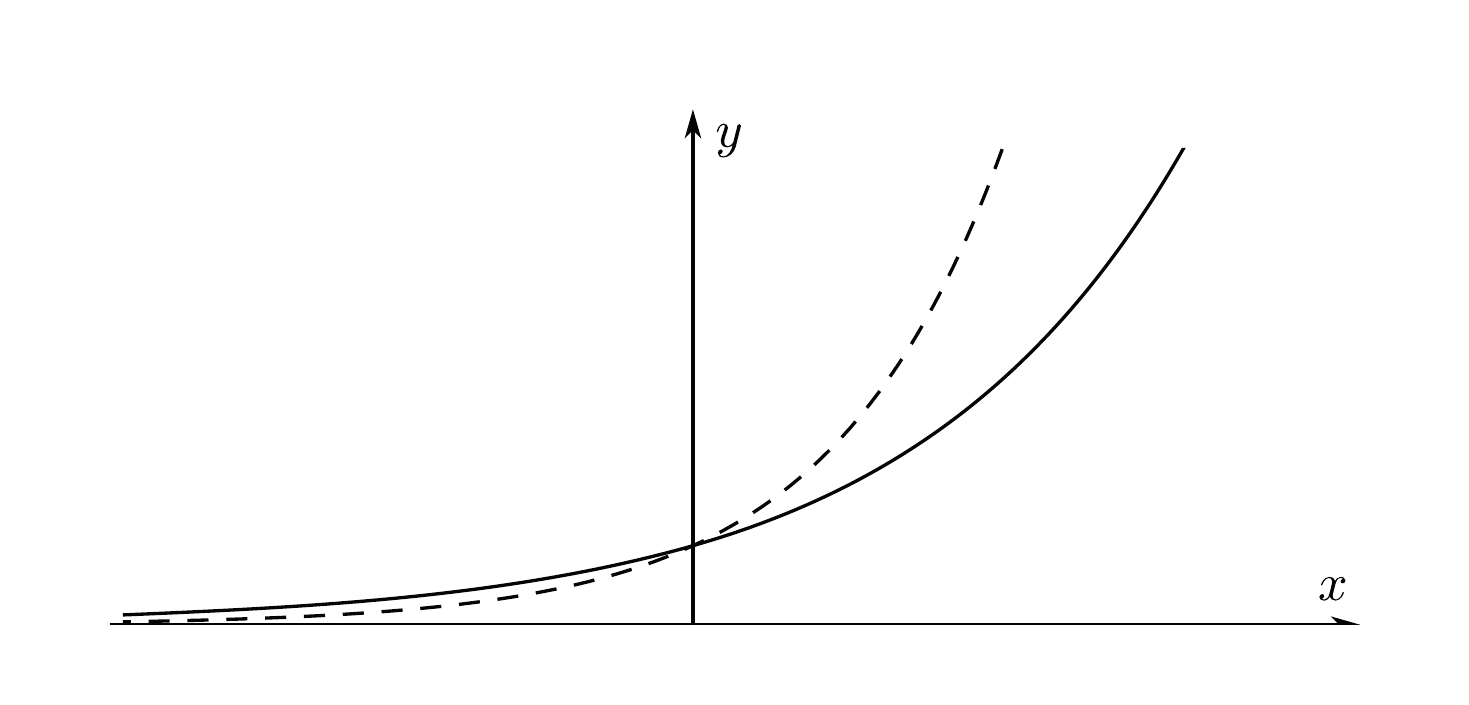
The graphs of two functions are shown here:
• is shown with a solid line, where is a positive real number
• is shown with a dashed line
• is shown with a solid line, where is a positive real number
• is shown with a dashed line
1
for some
2
for some
3
for some
4
for some
Which of the above statements could be true?
Discussion
Discuss this questionNo discussions yet. Stuck, or want to share an approach? Start the first one.